Scientific Reasoning in Spatial Data Science Education
Data science students often have incredible technical skills in computation and statistics but still have trouble critically solving problems with data. We are collaborating with several partners to address this problem through new courses and teaching materials featured here. Students learn to think differently about solving data problems -- they go from more mechanical applications of computation and statistics to using scientific reasoning as the logic for solving spatial data problems - and avoiding common cognitive and statistical pitfalls.
This integration represents a unique opportunity for the social sciences and the humanities to leverage their traditional strengths at UChicago for (spatial) data science education.
More information here about this CSDS priority area, which is led by Julia Koschinsky.
Learning Scientific Reasoning and Avoiding Statistical Pitfalls

In the Age of A.I., the core skill of critical thinking is more important than ever. Becoming a Data Scientist in the Age of AI: Developing Critical Skills Beyond Chatbots teaches students how to leverage chatbots to solve data problems while developing critical data science skills beyond what chatbots can do. Students will experience that data doesn’t speak for itself and that you cannot avoid pitfalls by blindly applying information from chatbots.
The course (currently under development) is based on 9 Pitfalls of Data Science (Cordes & Smith) and Thinking Clearly with Data: A Guide to Quantitative Reasoning and Analysis (Bueno de Mesquita & Fowler). It will include hands-on exercises using data that students learn to analyze using SQL with the help of ChatGPT. Students will be led into cognitive or statistical pitfalls. Once encountered, these pitfalls will be analyzed and understood through in-depth lectures, granting students a second chance at the analysis with newfound awareness and caution. Pitfalls to be explored will include regression toward the mean, selecting on the dependent variable, using bad data, confusing correlation with causation, and the potential for doing harm.
While this course is not explicitly about spatial data science, the next course adopts the same framework to cover spatial reasoning and pitfalls.
Partners: This course is being co-developed with Jay Cordes.

The Spatial Reasoning and Pitfalls course is about how to reason -and not to reason- with spatial methods and data. It adopts the framework developed for the statistical pitfalls course above and is currently under development. It will be taught by UChicago's GIS Librarian Rob Shepard in spring 2025 at UChicago.
To start, the courses will teach you to recognize and avoid spatial data gotchas like null island, misaligned projections or geocoding errors (see The Immigrant Paradox in Chicago: Real or Artifact?). You will also learn about spatial methods pitfalls such as the modifiable areal unit problem (MAUP), selecting on the dependent variable (NYC's geocoded stop and frisk data), Simpson’s Paradox / Spatial Regimes, and spatial patternicity (spatial signal vs noise). Also included are pitfalls re. the interpretation of spatial results, such as ecological fallacy and spatial cluster cores vs neighbors. Last but not least, the course will cover spatial examples of classic cognitive and sampling biases, such as confirmation bias and selection bias.
Partners: This course is being co-developed with UChicago's GIS Librarian Rob Shepard.
Scientific Reasoning to Improve Decisions and Data Science

Sense & Sensibility & Science@UChicago: Scientific Thinking in a Democracy is about learning how to better incorporate into our thinking and decision making the problem-solving techniques of science at its best. Many insights and conceptual tools from scientific thinking are of great utility for solving problems in your own day-to-day life and in a democracy. Yet, as individuals, as groups, as whole societies we fail to take full advantage of these methods. The focus in this course is on the errors humans tend to make, and the approaches scientific methodology has developed (and continues to develop) to minimize those errors. The course includes a discussion of the nature of science, what makes science such an effective way of knowing, how both non-scientific thinking and scientific thinking can go awry, and how we can reason more clearly and successfully as individuals, as members of groups, and as citizens of a democracy.
This course was offered at UChicago in spring 2024 (more photos) and will be taught again in spring 2025. It was customized by UChicago faculty and TAs, building on a decade of experience with developing the course at Berkeley and, more recently, at Harvard.
The course is included on this CSDS priority page because of its focus on scientific reasoning and statistics. Future versions that explicitly incorporate (spatial) data science are under development.
Partners: Saul Perlmutter & team at UC Berkeley, Aditya Ranganathan and Eamon Duede at Harvard, at UChicago: Reid Hastie (Booth), Jordan Kemp (Physics), Noa Perlmutter (Cognitive Science) and Doug Williams (Data Science and Public Policy).

The cholera & scientific inquiry project consists of a series of teaching materials under continuous development to introduce undergraduates to exploratory spatial data analysis in the context of scientific inquiry; following the footsteps of historical figures who were collecting, analyzing and interpreting data to understand how cholera was transmitted – and how it could be stopped. For instance:
Instructor Guide: Teaching Scientific Inquiry in the Context of Cholera Theories and Evidence in 19th century Britain (Peter Vinten-Johansen & Julia Koschinsky)
8 Datasets with Documentation
GeoDa Scripts: EDA and ESDA with GeoDa John Snow & the 19th Century Cholera Epidemic
Video & Storymap: How Do we Explain a Puzzle? John Snow and the 19th Century Cholera Epidemic
Video & Storymap: How Plausible Is an Explanation? “Experimental” Research Designs to Explain Cholera Transmission
In a collaboration with Tom Coleman, we are also working on a book project to understand (spatial) data science in the context of scientific inquiry and how the plausibility of alternative theories was assessed based on different evidence, and how the rejection of theories based on countervailing evidence worked (or not!). Here is a working paper related to this project:
Causality in the Time of Cholera: John Snow & the Process of Scientific Inquiry (Coleman, Koschinsky & Black)
Partners: Tom Coleman (UChicago Harris) and Peter Vinten-Johansen (Emeritus Michigan State).
Making Spatial Data Science Relevant to Underrepresented High Schoolers

The Data4All Bridge workshop (Data4All; see photos) teaches high school students who are underrepresented in STEM how to use computation, statistics, and mapping to address real-world data problems and puzzles. This focus on reasoning with data seeks to broaden students’ understanding of what data science is, beyond a more narrow technical focus on programming and statistics. It also highlights the relevance of data science to a broad variety of science, technology, engineering, and mathematics (STEM) and other fields, including college and career options students did not associate with data science before.
Partners: Data4All is hosted at UChicago’s Data Science Institute (DSI) and was developed in a collaboration between DSI, Argonne National Labs, the Center for Spatial Data Science, and the Office of Civic Engagement.

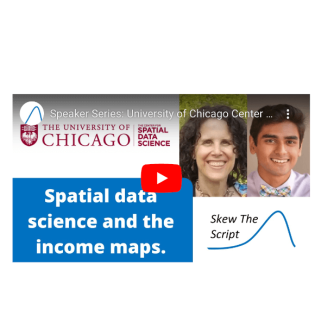
This project is a collaboration with an innovative nonprofit, SkewTheScript, to make statistics and math more relevant and engaging for students. Its curriculum is used by over 20,000 high school teachers (reaching 400,000 students), often in Title I schools, but also at UChicago’s UChicago’s Data4All Bridge Workshop (see above). The share of students passing AP Statistics exams has been increasing dramatically in classes using SkewTheScript materials.
We worked with SkewThe Script on a lesson that illustrates sampling methods with spatial data using the case of income segregation and race. We extended this lesson from one city to 100 US cities to make it more relevant to students’ local experiences (see this webinar for details). The next step is to build a web map to automate the sampling calculations that high schoolers currently compute by hand in the paper version and free up time for students to gain a deeper understanding of different sampling methods by exploring them for their city.
Partners: Dash Young-Saver (Founder of Skewthescript.org), Nico Marchio (Mansueto Institute for Urban Innovation) and Nikhil Patel (Class of '26).
 THE UNIVERSITY OF CHICAGO

