THE UNIVERSITY OF CHICAGO
Geoda+
GeoDa: An Introduction to Spatial Data Analysis

GeoDa is a user-friendly software program that has been developed since 2003. 20 years later, over 630,000 analysts have downloaded the program across the globe. What differentiates GeoDa from other data analysis tools is its focus on explicitly spatial methods for analyzing spatial data.
GeoDa is designed for location-specific data such as buildings, firms or disease incidents at the address level or aggregated to areas such as neighborhoods, districts or health areas. The program helps researchers and analysts translate data into insights by adding spatial statistical tests to simple map visualization, linking data views of spatial and non-spatial distributions, and enabling real-time exploration of spatial and statistical patterns.
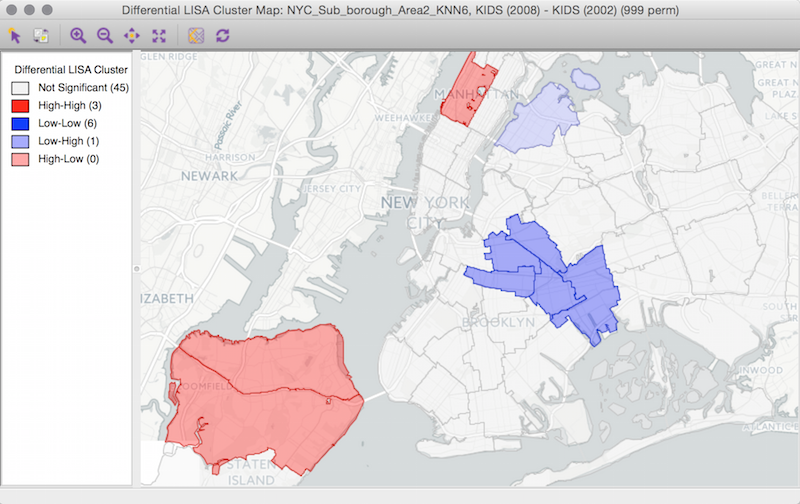
Spatial statistical tests distinguish patterns that just look like spatial clusters from those that are spatial clusters with a degree of certainty, compared to spatially random patterns. Since we are prone to “patternicity” or overdetection of patterns, statistical tests help differentiate clusters that are real from those that are not. Examples of these statistical tests in GeoDa include so-called local indicators of spatial association (LISA) that locate statistically significant hot spots and cold spots on a map (see LISA map below). Another illustration is a map of residuals from a multivariate regression model to identify places where the model does not perform as well as in other places. In comparison, residual maps from spatial models can show how model performance is improved across places.
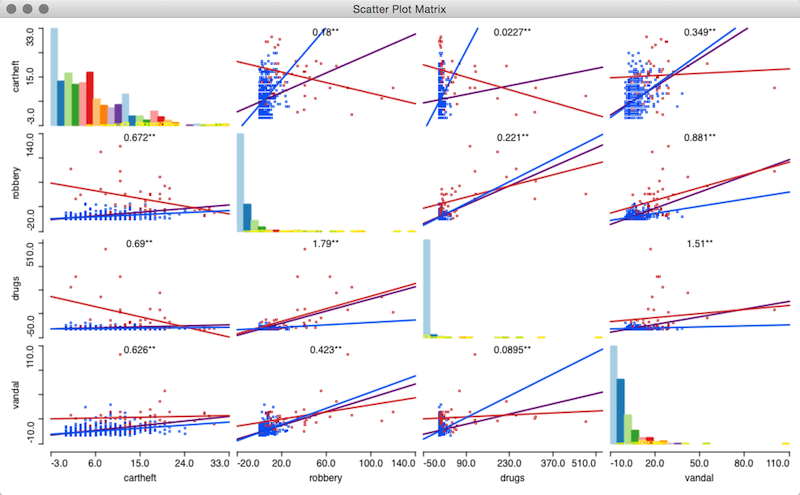
The complexity of making sense of the characteristics of one area is increased further by jointly analyzing multiple areas, now and over time. GeoDa helps structure the detection of new insights in this context by visualizing spatial and statistical distribution of each variable in separate views. These views are linked to allow analysts to select subsets of a variable in any view and explore where in the spatial and non-spatial distribution these subsets fall. For instance, the relationship between homicides and economic deprivation has been found to hold in urban but not in rural areas (Messner and Anselin 2004).
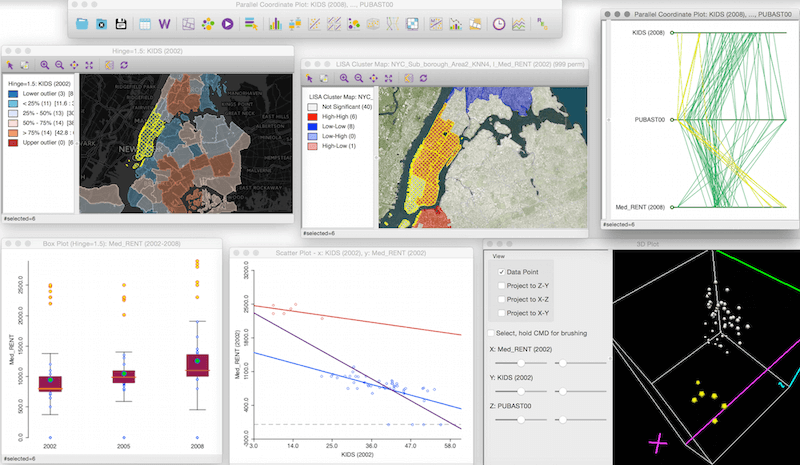
GeoDa supports the detection of insights in real time through an interactive design that dynamically updates the selection of data subsets across views. In some views, statistical results are recomputed on the fly. For instance, a statistical test (Chow) that is updated dynamically helps analysts detect sub-regions that diverge from overall trends, as in the homicide case above (a so-called Chow test is used to compare differences in the regression slopes of selected and unselected observations in a bivariate scatterplot). In another example, an averages chart aggregates values for selected locations and across time to statistically compare differences in trends for these sub-regions. This can be used to explore differences on the fly between impact and control areas before and after an intervention.
More about GeoDa, developed by Luc Anselin and Xun Li.
Learn GeoDa by following Luc Anselin's workbook chapters, also in Book format (vol 1 and vol 2). Data for these tutorials are available here.
Anselin, L., Li, X., & Koschinsky, J. (2022). GeoDa, from the Desktop to an Ecosystem for Exploring Spatial Data. Geographical Analysis, 54(3), 439-466.
PySAL SPREG: A Spatial Econometrics Package

PySAL spreg, short for “spatial regression,” is a python package to estimate simultaneous autoregressive spatial regression models. These models are useful when modeling processes where observations interact with one another. The package is under active development by Luc Anselin and Pedro Amaral.
The package allows you to estimate spatial regression models and spatial regimes models (variants of spatial regression models that allow for structural instability in parameters, i.e. these models allow different coefficient values in distinct subsets of the data). It also includes seemingly-unrelated regressions (and their spatial generalizations) to allow for correlation in the residual terms between groups that use the same model. In spatial seemingly-unrelated regressions, the error terms across groups are allowed to exhibit a structured type of correlation: spatial correlation. In addition, spreg supports spatial panel models to evaluate correlation in both spatial and time dimensions, and diagnostics.
More about PySAL, managed by Serge Rey.
Anselin, L., & Rey, S. J. (2014). Modern Spatial Econometrics in Practice: A Guide to GeoDa, GeoDaSpace and PySAL.